Blog > Real Estate Market Report - Turlock, CA (Nov, 2023)
Current Market Condition
139
Active Listings
62
Pending Listings
$545,000
Median List Price
The median sale/list price for properties appears to be on an upward trend, with a few fluctuations, over the next year. The median price for November 2022 is $425,000 and by October 2023 it has increased to $489,000 in the first dataset. In the second dataset, the median price for November 2022 is $410,000 and by October 2023 it has increased to $480,000.
Median Sale/List Price

The median sale price per square foot shows an increasing trend from November 2022 to June 2023, with a peak of $305.587 in July 2023. After that, the price slightly decreases but remains relatively high, with a median sale price per square foot of $306.067 in October 2023.
Median Sale Price per Square Foot

The median sale price to list price ratio was consistently at 1.0 from November 2022 to April 2023, indicating that homes were selling at their asking prices. However, there was a slight decrease in the ratio in January and February 2023, with a low of 0.979. The ratio then increased again in the following months, but fluctuated between 0.985 and 1.0.
Median Sale Price to List Price Ratio

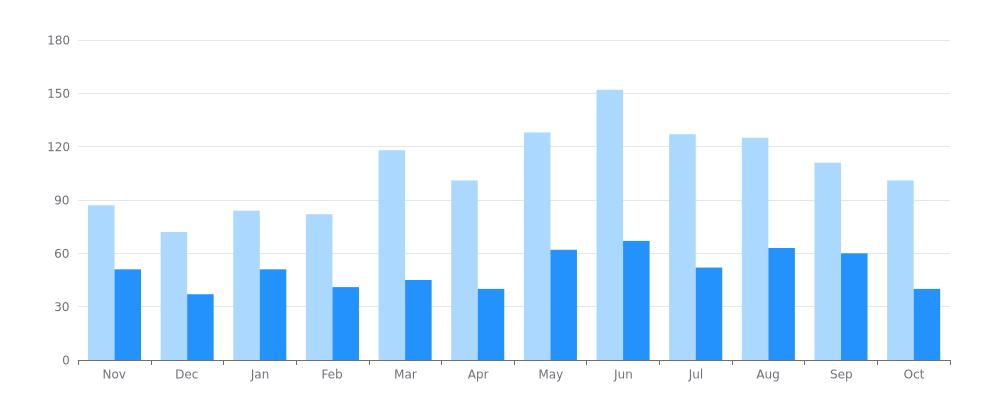
The number of properties sold/listed showed a consistent increase from November 2022 to May 2023, with the highest count of 152 properties listed/sold in June 2023. However, the numbers began to decrease in the following months, with only 101 properties listed/sold in October 2023. The number of properties listed/sold was consistently higher than the number of properties sold/listed throughout the given time period.
Properties Sold/Listed
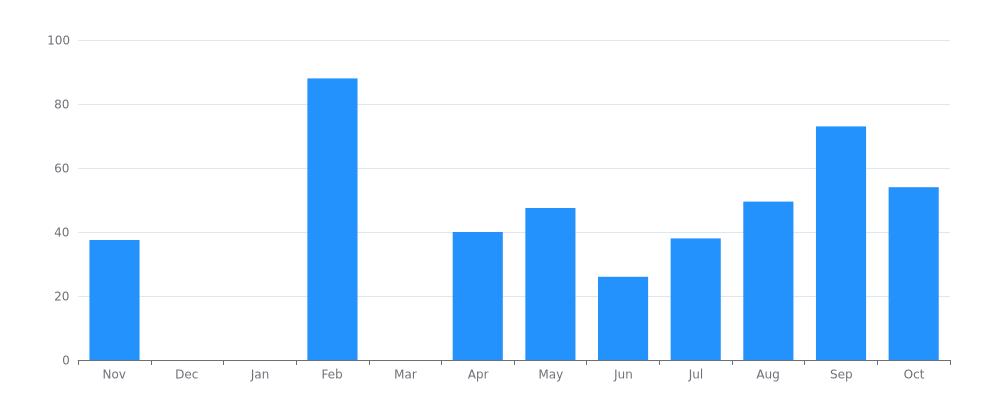
The median days on market for properties in November 2022 was 37.5, but dropped to 0.0 in December 2022 and January 2023 before increasing to a high of 88.0 in February 2023. The median days on market remained relatively stable from March to July 2023 before increasing again in August to 49.5 and peaking in September 2023 at 73.0. By October 2023, the median days on market had decreased to 54.0.
Median Days on Market